Data Description
by Lei
Sanitary Conditions of Food Establishments
In order to evaluate the inspection methods and give more detailed advice, the whole situations should be analyzed firstly. Therefore the original dataset had better be preprocessed and cleared up before any analysis.
Here, we use the pass rate to represent sanitary conditions of food establishments. Pass rate is defined as numbers of pass and pass with condition over numbers of all results using results from all inspection types except license and license re-inspection since these kinds of inspection are announced, thus it’s more like a pre inspection while others are unannounced.Pure pass rate is defined as pass rate except of pass on conditions.
Changes over facility type
The types are facilities are various, but there are only a few common types of facilities: Nearly 130,000 facilities are identified as ‘Restaurant’. Grocery store and school are also common facilities. These three types of facilities account for over 90% of all facilities.
The proportions of inspections results for different facility types are similar. Most of the facility types have a overall pass rate which include result pass and pass with conditions of 60% to 80%. Among all the facility types, school, hospital and shared kitchen have relatively high pass rates. The outlier is type unknown, whose results are mostly license suspended.
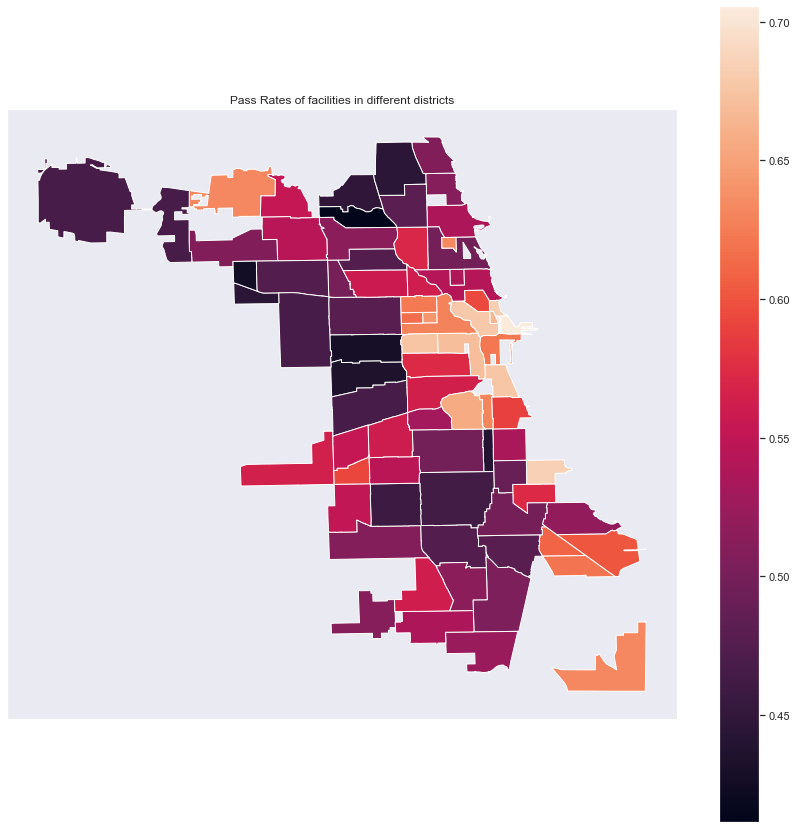
Changes over districts
How does food sanity condition correlate to district?
We draw a pass rate for districts. There are considerable differences between the pass rates of different districts of Chicago. In the east of the city, which is the city center with the highest facility density, pass rates are above 60%, so the sanitary condition is generally satisfactory. In contrast, on the west side where there are also lots of facilities, the pass rates are only about 45%. In addition, some districts in the north and south part of Chicago also have a clustering effect of low pass rates.
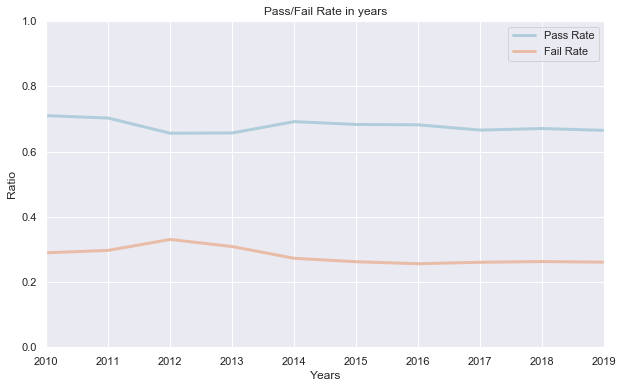
Changes over time
How does food sanity condition correlate to time?
To answer this question, we performed analysis yearly and monthly. From the stack plot, a sudden decrease of pure pass rate happened between 2017 and 2018, which might due to the changes of inspection methods in 1/7/2018. It’s said their new inspection methods may be more stricter than the previous one. Besides, pass rate and fail rate basicly keep the same over years, except for 2012 where had a relatively low pass rate and relatively hight fail rate. For the changes between 2017 and 2018, we would discuss it later.
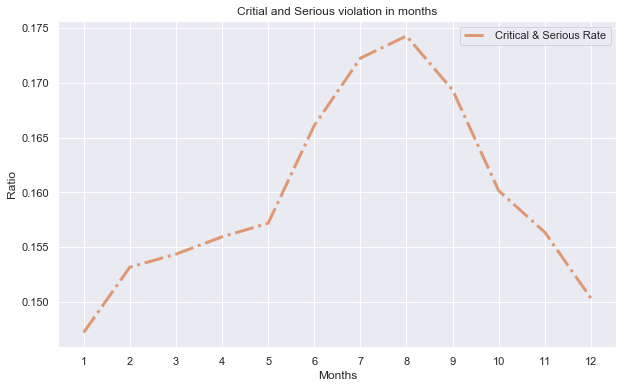
We hope to find a pattern behind months. From the second figure, the approximate trend is that fail rate increases the same time as month increases which is not what we expected. But if we only look at pass at the first figure, there is an obvious drop from July to September which indicates more critical or serious problems would appear in hot weather.
Consider violation rate from 1 to 29 which implies critical and serious violation and may create immediate or potential health hazard. From the plot below, its rate has a significant increase between June and September when Chicago has the supper hot weather. Now, considering the following situation: purely pass rate decreases, pass rate keeps the same, and critical & serious rate increases, whose corresonding explanation is: establishments have more critical and serious food safety problems but they would not take care of them in daily life and could correct these violation during the inspection. What a threatening food safety condition!
Therefore, combining pass rate, purely pass rate, and critical & serious rate, we can say that the sanity condition of food establishments is indeed worse in hot weather.
Subscribe via RSS