Evaluation of Inspection Methods
by Lei
Evaluation of Inspection Methods
Things related to inspection methods are inspetion type, inspection frequency (which is related to Risk for canvass), and the changes to food inspection procedures. So we gonna dive into these three parts to evaluate the inspection methods.
1. Inspection type
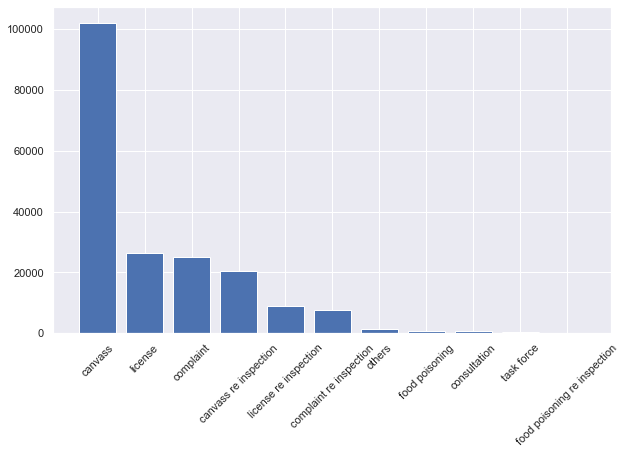
For each inspection type, their distribution in results changes a lot. To find a pattern, we placed re-inpsections together so it’s clear that re-inspections would have highest purely pass rate and lowest fail rate.
We redraw the figure above ordered by distribution of inspection number.
What’s more, one of the suprising results is that license inspection actually has the lowest pass rate. Since in license inspection, a health inspector from the CDPH will contact the applicant to arrange for an inspection while the rests inspection types are unannounced inspetions. For us, results from announced inspection should be better than that of unannouced inspection where establishments have no time to prepare for the inspection. Thinking through, we think it’s probably because applicants are unfamiliar with the requirement of CDPH when the first time they started their business.
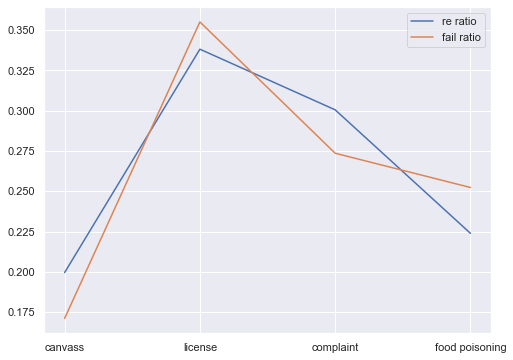
We also check what is the re-inspection ratio of each inspection type. Three possible situations are listed as follows:
- re-inspection rate = fail rate: For every fail result in the first inspection, it is re-inspected and passed the first re-inspection.
- re-inspection rate > fail rate: For every fail result in the first inspection, it is re-inspected and some of them did not pass the first re-inspection.
- re-inspection rate < fail rate: For every fail result in the first inspection, it is partially re-inspected.
So applying these situations in the following figure, complaint inspection has the highest fail ratio and and also highest?
we may draw a conclusion that
Note that we do not consider license inspection since it is compulsory.
So applying these situations in the following figure, complaint inspection has the highest fail ratio and and also highest? we may draw a conclusion that Note that we do not consider license inspection since it is compulsory.
2. Inspection frequency
a. Real Inspection Frequency
As Chicago’s government policy:
In general, risk 1 establishments are inspected twice per year,risk 2 establishments once per year, and risk 3 establishments every other year.
So we are wondering if the inspection frequency really satisfys the state’s requirement? If yes, is the frequency reasonable?
The way we calculate inspection frequency is by averaging the total inspection times over its active year which is defined as from the first time doing the canvass inspection to the last time doing that. Note that here we only consider canvass inspection because this is the only type related to risk.
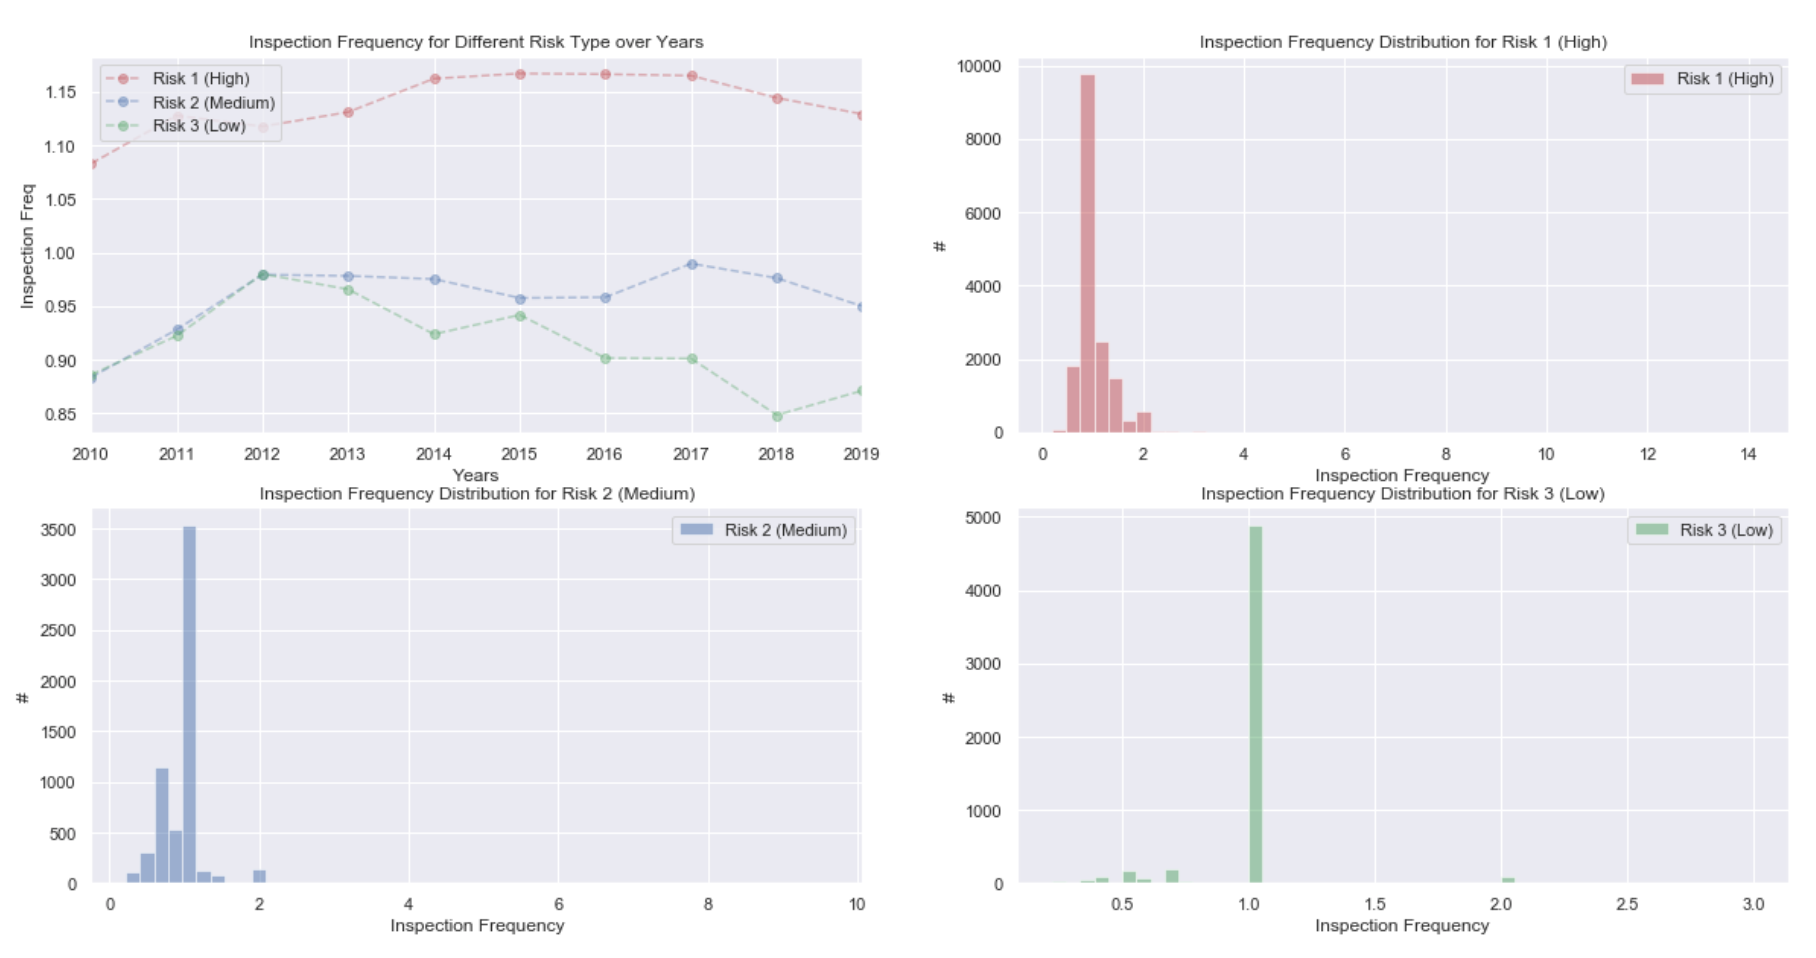
We think the inspection frequency is also related to inspection period. Considering the period for risk 3 is two years, so if one establishment only do their business for one year, it would not make sense if we count them in. But for other type of risk, their inspection period is equal or less than one year, it would not cause serious impacts if we included them. We can gain some insight into it from the distribution for risk 3.
After dropping those only lived for one year for risk 3, we redraw the inspection frequency for different risk type over years. Now it makes more sense to us although the value for risk 3 is still higher than 0.5.
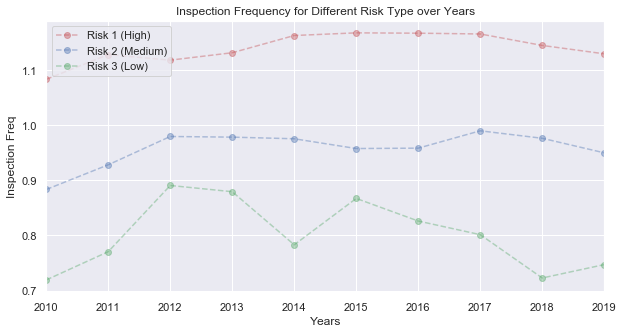
But now consider how many establishments we have dropped, that is 4754, which takes up 84% of the establishments being risk 3. It would not be reasonable for having only 16% of data, but it can give us some clues for understanding the inspection frequency for risk 3!
The conclusion for real inspection frequency is that there is a slight difference among different risk.
- The real inspection frequency for risk 1 is around 1.13.
- The real inspection frequency for risk 2 is around 0.95.
- The real inspection frequency for risk 3 is around 0.80.
Besides, the inspectors really do not follow what they are asked to do! News also reflects our consideration.
b. Relationship between Inspection Frequency and Results
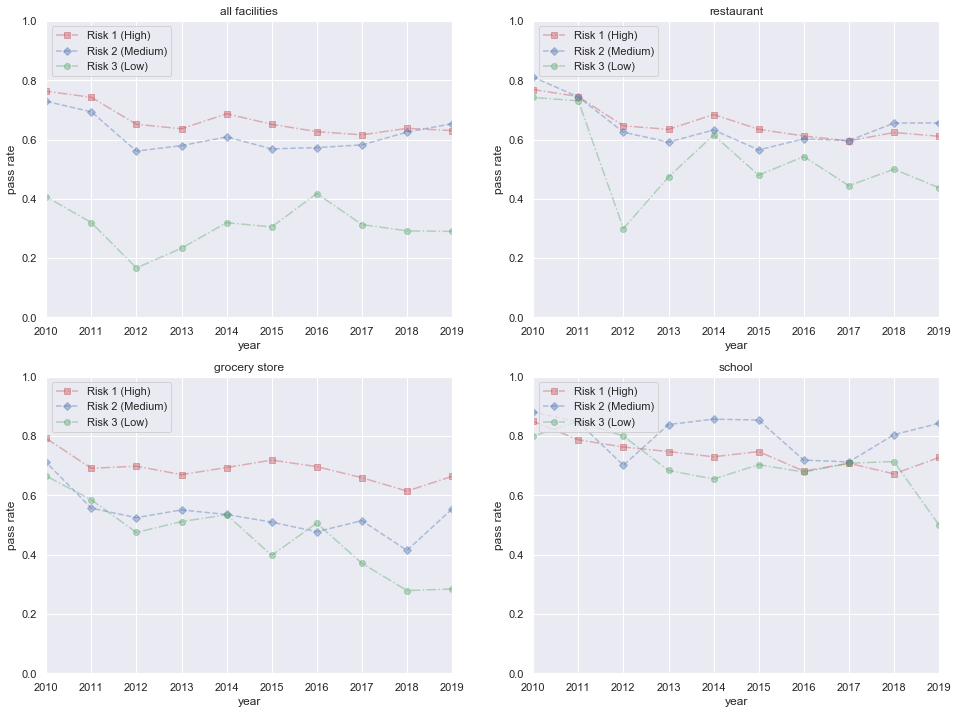
The relationship between risks and results in figure below tells us pass rate would increase and fail rate would decrease if risk decreases. It means that with the frequency of inspection increasing, the pass rate will increase.
However, from the figure below, we can see that the pass rate will not change a lot in School, since this type facility is related to the next generation, it is more strict than other facilities.
Subscribe via RSS