Violation result analysis
by Lei
Violation result analysis
1. Basic result analysis
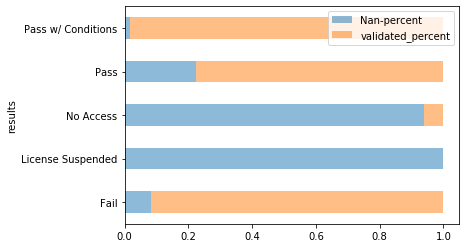
We noticed that the Nan values distributions over differents are quite different.
Except the situation of missing values,Nan values’ proportion are higher in Pass,License Suspended,No Entry and Not ready we considering that there are different reasons each ithem that occur this phenomena:
PassWe consider that this indicate that there is no violations were found during the inspection.License SuspendedFrom the dataset discription,we know that suspending license only occurs when critial violations found or violation not been corrected before re-inspection.
We think that reason why this category has suchNanvalue proportion is that when the most inspector didn’t record the violatons once they decided to suspend the license of the ficility.Not ReadyandNo Entryhave similar sitiation that happened inLicense Suspended
2. Description of Inspection
According to the website about the detail of Chicago food inspection description:link.
We can see that the results are related to the violations and the inspection type of this inspection.In this document, there is detailed description of different violations.
- Critical vioilation: From the description,Onece a critical violation found in fiacity,if it can not be corrected immediately,it will recieve a
License suspended. - Serious violation: Serious violationo found without correction immediately won’t casuse
License suspended, only causeFailand a re inspection.But if serious violation found in re inspection will cause aLicense sunspended. -
Minor violarion: within Minor violations can still have a
Passresult. - Exception: In License related inspections, any violation including ‘Minor’ will cause a
Fail
In the following part, We want to have a view of the Violation-Results relationship:
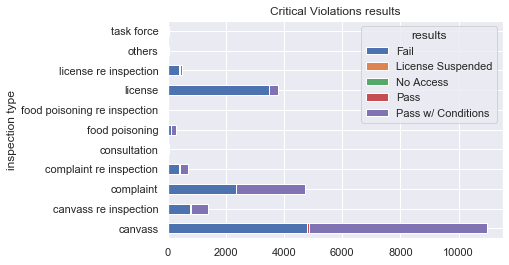
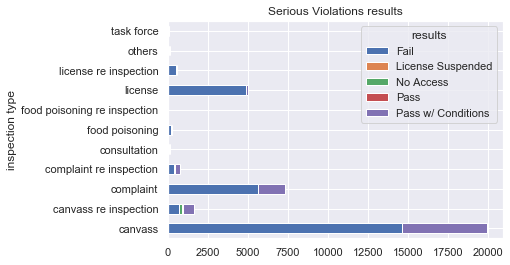
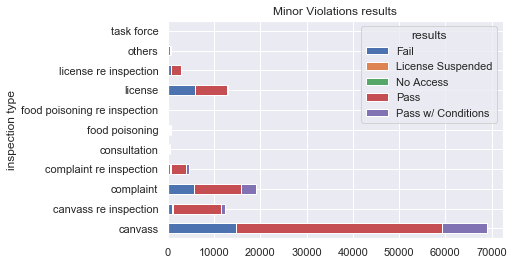
We absored that in real inspection, they didn’t follow exactly as described, for example, In the description, Fail result won’t appear in the inspections that Critical viol was found.
As for different kinds of inspections, it can be easily noticed that their results distributions are not the same as well.
3. Violation Changings
From the resource of this dataset:Chicago food inspection.
We know that the inspection procedures using new form to record the inspection data as described here:new data form
The main Changes are about the Violations, including the categories and responding Violation numbers. In the new dataset, the types of violations are not 45, instead of 63.
Corresponding name changes of violations’ categories are as follows:
Minor ViolationstoCore (C) ViolationSerious ViolationstoPriority Foundation (PF) ViolationCritical ViolationstoPriority (P) Violation
From the description,it can be seen that there is a corresponding relationship between new and previous violation categories.
For these changed violations, there is no description about the which catagory that new violations should belong to.In this case, we tried to use clustering to group violations depends on their pass rate of 4 most high-frequency inspection types.
Since previous inspection violation have the truth category, We did k-Means clustering for the violations before 1/7/2018 to check the the performance
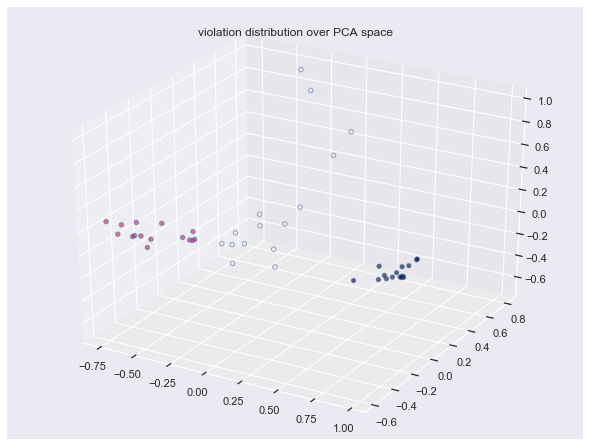 The F1_score of the model above is 0.79 for the violations before 1/7/2018,. And the distance of clustered group can be seen clearly as well.So we did the clustering for the new violation as well.
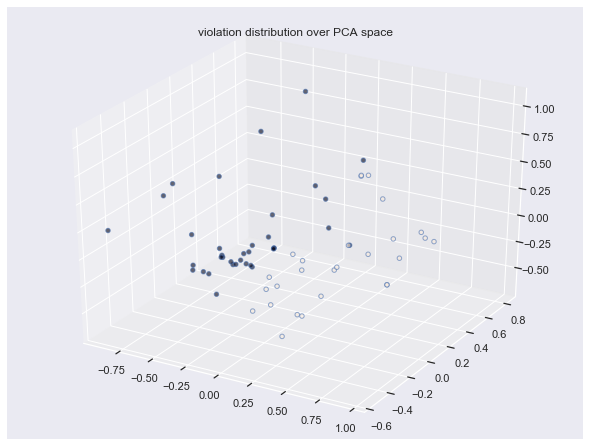 For the violations after 1/7/2018, The clustering result seems not as well as the one before 1/7/2018.
From graph below,it can be seen that bafore 1/7/2018, although pass_rate and pass_w_condition rate fluctuate some times,the overall trend is stabilizing.
While after 1/7/2018,the ratio of these two inspection results to all results is reversed immediately.And we also can ovbserved that in the further time till newest inspection data,their ration tend to back to previous relationship. We think this might be the reason why it’s hard to use result_rate of certain violation to find out the violation catagory.
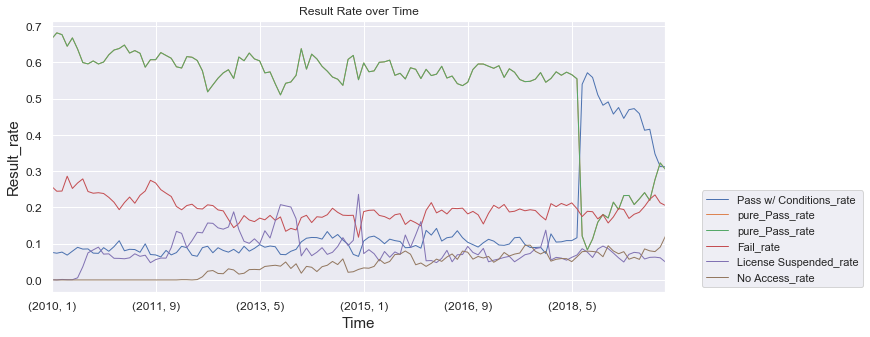
Although we cannot use result_rate to infer the violations’ severity, we notice this changing of inspection’s violation category might help to improve the sanitary condition of facilities. Since the pure_Pass_rate has a huge falling after changing to new categories and then kept climbing, this might indicate that this new category put more violation not been used or considered serious before. And by increasing corresponding severity, it can force the facility to do better in this despised ascpect.The climbing of pure_Pass_rate proof of its effectiveness.
Subscribe via RSS